Inexpensive Cisco Network Log Analysis
By: Mark Lachniet (mark@lachniet.com)
Version 0.3 - Tuesday, October 04, 2005
1.0 Executive Summary
This document is intended to explain why network logging and log analysis is important, and provide instructions for people who want to do this on their Cisco equipment (especially the PIX firewall) without spending a lot of money. Although you may not get all of the spiffy features that you will find in high-end offerings from companies like Cisco, NetIQ, Symantec and others, you can get a very good security bang for the buck with simple and inexpensive systems.
Although this document is specifically intended for logging on a Cisco PIX, pretty much the same commands should work for other devices such as routers. You will see different screens, and Sawmill may detect them differently, but it is essentially the same process.
Please note: I have been informed that logging on other Cisco devices, notably routers, can be performed on a per-ACL basis, and tends to provide summary data, rather than detail. You should look into this if your results are not what you think they should be.
1.1 Why Log and Analyze Data
The first question you will ask yourself is why do I need to log? This is a question frequently asked by people who have never been hacked, but one that is easily answered. Logging, and more importantly analyzing that log data in a meaningful way, can give you a number of benefits:??
Regulatory Compliance. If you are in a regulated industry, and have to worry about regulations such as SOX, GLBA, HIPAA or other lovely generators of work, you may be expected to do this. You need to talk to your own auditors (and possibly your legal counsel) but in my opinion, if you dont do it, you have a material weakness in your I.T. controls
Improved Security. You can improve your security immensely by knowing what is going on with your network. I have had customers who, until we came along, had no firewall logging at all. In one case, the organization had been complaining about slow Internet traffic, but didnt know why. As soon as we hooked up a log analysis program, we were able to instantly identify the problem 1.6gb of FTP data a day to a computer in the United Arab Emirate. Of course, it was all pirated software. Mystery solved. Further, just reading through the firewall logs in raw format is very difficult. Not only would you have to page through megabytes and megabytes of log data, youd have precious little chance of finding that needle in the haystack that was indicative of a hack. With pretty charts and graphs and traffic summaries, you can easily identify anomalies (like traffic spikes at 3am) that you might otherwise have missed.
Accountability and Forensic Evidence. Having a log of all the data that goes through your devices can be really useful for figuring out what happened during an incident. I cant tell you how many times Ive gone out to investigate a hack of a Windows server and discover that it was basically impossible to figure out where the attack came from, because the hacked host didnt log IP addresses and the firewall wasnt capturing logs. If you have a firewall log, it helps your forensic analysis immensely. In addition, this may come in handy for other incidents that you might need to take to the legal system intellectual property issues, employee malfeasance, inappropriate use of resources, and who knows what else. If you dont have network-level logging you are basically out of luck when it comes to finding perpetrators or proving a case in court.
Troubleshooting and Network Administration. Having
network logs also helps you to manage your day-to-day business of being a
network administrator. For example, you could look at your firewall reports
and see that you are slowly starting to saturate your internet connection, and
know with a certainty (and more importantly a documented financial case) that
you need to upgrade your ISP circuit. You might also look at protocol usage
and see way too much streaming radio, and decide that you need to apply some
Quality of Service controls on your traffic such that HTTP to Slashdot.org
always has a higher priority than streaming media. In another example, it is
frequently necessary to analyze protocol usage on your network in order to get
the most restrictive access control rules possible. For example, you might
need to see exactly what ports a machine from the inside network needs to use
to talk to a machine on the outside or DMZ. Using log analysis, you could home
in on this traffic, and then figure out exactly which ports you could leave
open, and which you could safely close down without breaking things.
1.2 What Systems to Log
The next question you need to ask yourself is, what do I need to log? By the name of this document, you can guess that we are talking about Cisco equipment such as routers and firewalls. However, the same procedures will work for other equipment with some modifications. The following are good candidates to log data from:
Internet Firewall. Presumably you have a PIX firewall. If you dont, you might want to consider getting one. Even small offices and home users would benefit from a PIX. Even if you are only connected through a DSL or cable modem, getting a cheap PIX 501 gives you the benefit of useful logging, VPN functionality and other handy features. For the most part, I am assuming that you are most interested in getting data off of your PIX.
Internet Router. It is possible, but hopefully unlikely, that you are using a Cisco router such as a 2600 in place of a firewall, using the IP feature set. If so, all of what we describe here should work pretty well without too many changes. You might also want to analyze data on your ISP router if, for example, you have some hosts that are between your firewall and router, and that your PIX doesnt control or see the traffic for.
Partner Routers. You may have routers, possibly even behind your firewall, that are connected to partners and vendors. If these exist in your network, you may very well want to analyze their usage as well. You should never trust the competence or intentions of any entity outside of your control, and this includes your partners. At least if you have log data from the routers that connect your organization to theirs, you can sue their pants off if they pass some kind of worm to your network or something. It would also be a good detective control, in that you could look at utilization and see if they are using their connection for things they shouldnt, like probing your network
VPN Concentrators and Wireless Access Points. Its also not a bad idea to trap data from your VPN concentrators. Frequently this data is not even trapped, let alone analyzed. Wouldnt you like to know what your VPN and wireless users are doing?
Other Stuff. Obviously, you probably want to log from IDS systems and other important systems, but we are focusing on network devices, and specifically hosts here.
2. Setting Up Syslogging
For the purposes of this document, well be using to handy and well-written pieces of software Kiwi Syslog, and Sawmill. Both of these are inexpensive and highly functional, and I strongly encourage you to support their authors. I am also assuming that you are setting this up on a Windows box. If you are so cool that you can do it on a Linux box, why are you reading this anyway?
2.1 Install an Operating System
Yes, you need an operating system. Windows server is not a bad choice, since it includes IIS which can be handy later on. Build up your machine, and enable IIS. Make sure you actually run Windows update about three hundred times until it stops complaining. Then turn on the auto-update feature so you have one less thing to worry about. Put this machine on your internal network.
2.2 Download and Install Kiwi
Next, go to http://www.kiwisyslog.com/ and download the latest version of the Kiwi Syslog Daemon. For our purposes, you can get by with the free version but I strongly encourage you to plunk down the cash for the registered version. Its just shy of $100 for a single license, and this is a good deal. You should support the author for his hard work, plus you get some spiffy features such as the ability to log data to a SQL database for later mining, forward events to e-mail, etc.
Now, run the setup program, and get your program installed. Select the option to install Kiwi as a service:
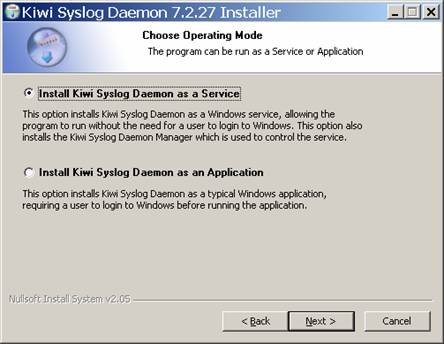
The rest of the default options should be fine.
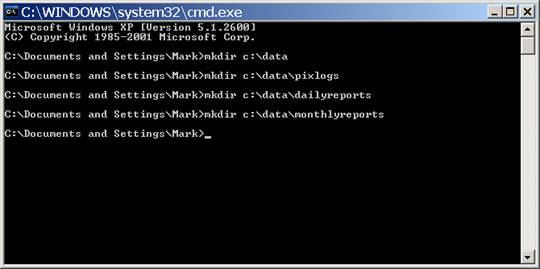
Now, manually create your data directory. I suggest the following:
- Create a data called c:\data
- Create a directory for your logfiles called c:\data\pixlogs
- Create a directory for your daily reports called c:\data\dailyreports
- Create a directory for your monthly reports called c:\data\monthlyreports
Now, run Kiwi Syslog for the first time.
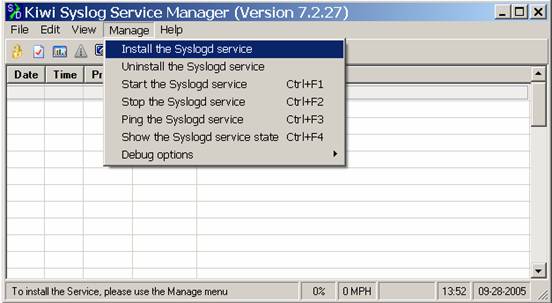
The first thing youll want to do is to install Kiwi as a Service, so that it starts up when your computer does. Obviously, you need to keep this computer turned on 24/7, or you will miss log data. To do this, click on Manage, then Install the Syslogd Service.
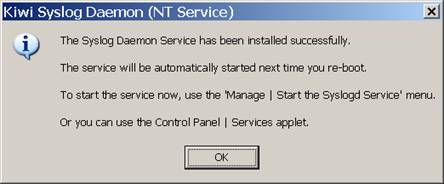
If nothing is messed up, youll see:
Then click on the option to Start the Syslogd service, and then go to File, Send Message to Localhost to test that your service is running. If it is correctly running, you will see a test message such as the following appear on the screen:
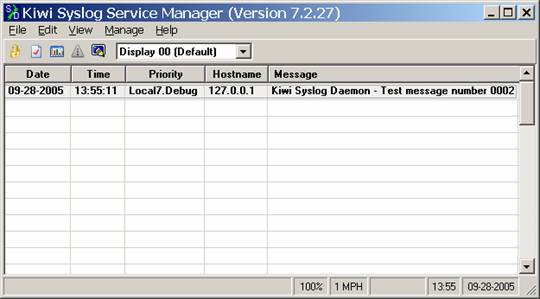
This indicates that you successfully installed the software and should be all set to start receiving messages from network devices. Please note! If you have a different service that is also running a syslog service (such as CiscoWorks) youll need to disable this, or change the port that is used.
2.3 Configuring Kiwi
Now that we have Kiwi installed, we want to change the default behavior a little bit. First of all, you want to change where all of the syslog data is stored. For the purposes of this document, we are assuming that you are only capturing data from a single device such as a PIX. If you want to capture data from several devices, youll need to create filters to drop that data into different log directories. I believe you need a registered version of Kiwi to do this, but essentially you want to do a filter based on the source of the syslog, and then for each of these, save to a different directory. It should be fairly easy to figure out.
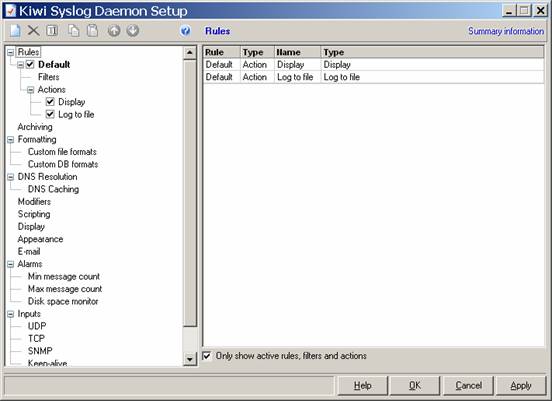
In any event, we want all of our data to go to c:\data\pixlogs, so we will modify the Kiwi configuration. Go to File, Setup, and you should see the behavior of the default filter right away:
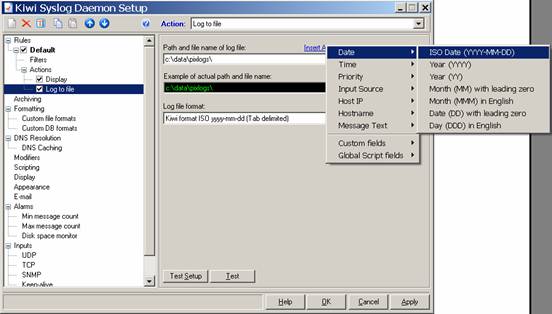
Now, click on the word Log to File on the left, and change the directory and filename. Well set our directory to c:\data\pixlogs, but well also want to use some of the special codes so that our logfiles are saved with time and date stamps on an hourly basis. First, type c:\data\pixlogs in the first box:

Then click on the Insert Autosplit value option, and select Date, ISO Date:
Once you have done this, type in an underscore, and then select Time and Hour. Once you are done, you should have something that looks like this:
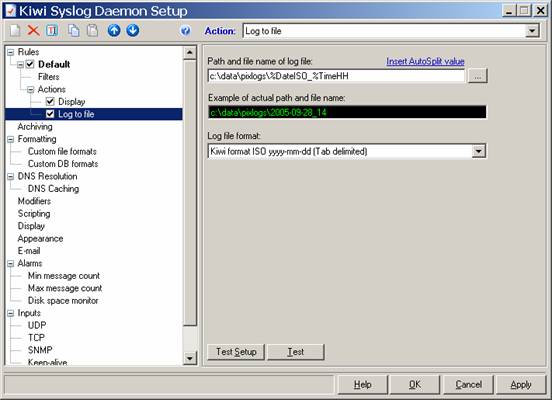
So far so good. Click OK. You now have logging set up such that you will get your log files broken down by the hour, chunk by chunk. This is a good thing, especially with Sawmill, as you can update your database on an hourly basis, instead of having to update a days worth at a time, which tends to bog down the processor. Next, you need to get your firewall to start sending data.
2.4 Configuring Your PIX
I will discuss how to configure a PIX firewall to start sending logs to your newly created Syslog server. You could very well be doing this on a Cisco router the procedures are very similar.
First of all, you might wish to acquaint yourself with how Syslog works on your device. For the PIX, refer to:
http://www.cisco.com/en/US/products/hw/vpndevc/ps2030/products_tech_note09186a0080094030.shtml.
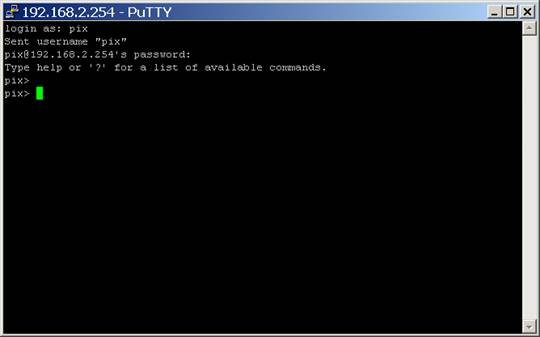
Now, connect to your PIX with a serial cable or SSH connection (or, god help you, a Telnet connection, but please dont use Telnet, its a terribly insecure protocol). In my case, I will use PuTTY to connect.
First, we connect to the PIXs inside IP address, and type in our password. When using SSH, the username is PIX, and the password is whatever you have configured:
Next, we must enter enable mode (the privileged mode) and make a backup of the configuration in case you really screw things up:
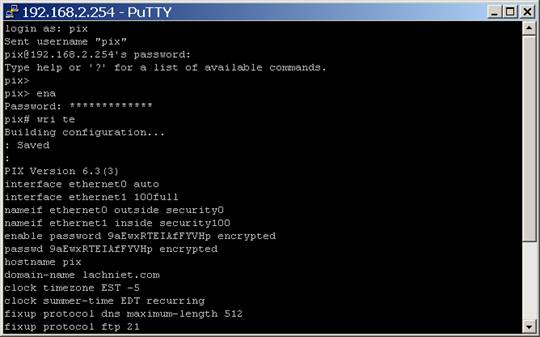
Page through the whole config, and save it to a text file for later. You may someday be glad you did.
Next, we are going to configure our logging parameters. First we enter config mode type typing config term. Next, we set the logging host with the IP address of our server running Kiwi, then we tell it the syslog settings we want. By default, we want debug level logging and facility 20. Debug logging gives us the most information, though you could use Informational. Why Facility 20? Why not.
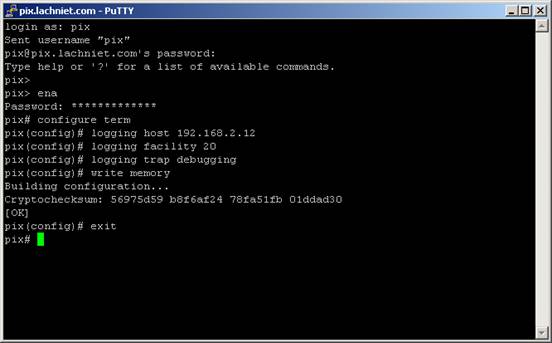
As soon as you type these items, your PIX should start sending information to your Kiwi syslog daemon. Since one of the default Kiwi rules is to display everything it receives, you should immediately see data on the Kiwi console such as the following:
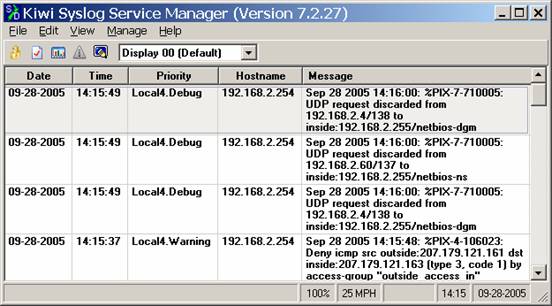
If you see this, GREAT! You are now trapping data and have a forensic trail for your network data. If you dont see this, you are bumming because it probably should have worked. Now that you have your data, you can now attempt to do some analysis of it. I suggest you wait an hour or so, so you can actually have some data to analyze before going to the next step.
3.0 Configuring Log Analysis
Having your log data logged to disk is great, but its not like you are going to page through 10gb of log data a day to figure out what is going on with your network. Enter Sawmill, the jack of all trades log analyzer tool. Sawmill, while not immediately intuitive to some has a wealth of features, and the ability to drill down into a zillion different log formats is very nice. Ive used it to analyze logs from proxy servers, web servers, firewalls and even goofy systems like Border Manager. Anyway, go ahead and download the latest version of Sawmill from the website at http://www.sawmill.net. Take the latest production version.
3.1 Install Sawmill
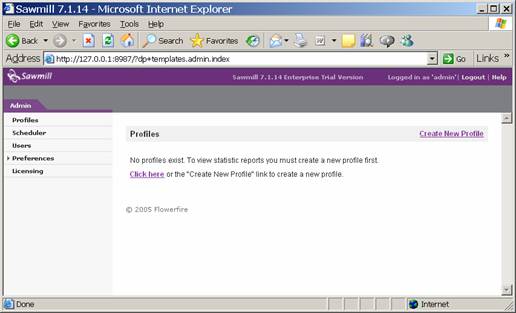
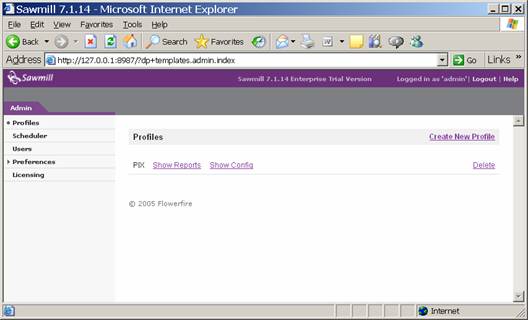
Install Sawmill as per the instructions. The default selections should be fine. Create a username and password that you will use to log into the Sawmill service. By default, Sawmill runs over HTTP on its own web server running on port 8987, so youll be accessing the administrative interface using a URL such as http://127.0.0.1:8987. When you have this set up, youll be faced with an empty Sawmill config.
3.2 Create your PIX profile
The first thing we want to do is to create a profile for our PIX. Click on Create New Profile in the upper right:
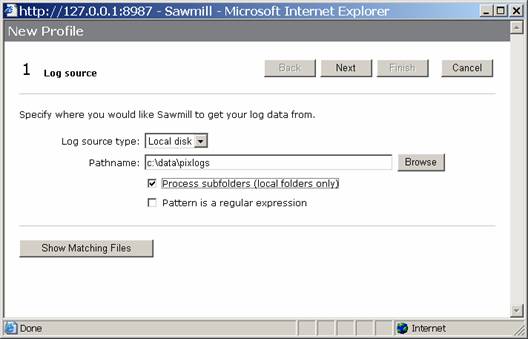
Next, type in the location of your logfiles, and click on the box to process subfolders. This will make is to that all files within the directory are processed, as you may someday want to do some organization of logfiles by date, etc.
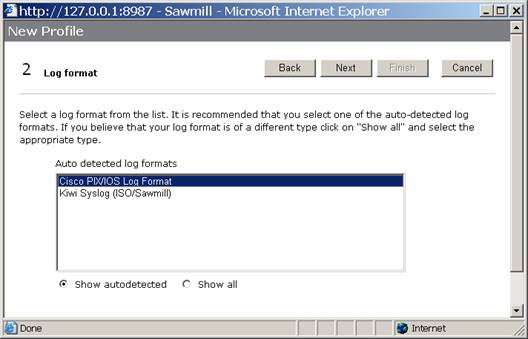
Click the Next button. Sawmill should discover your log files, and do some autodetection. Select the Cisco PIX/IOS Log Format option, and click Next.
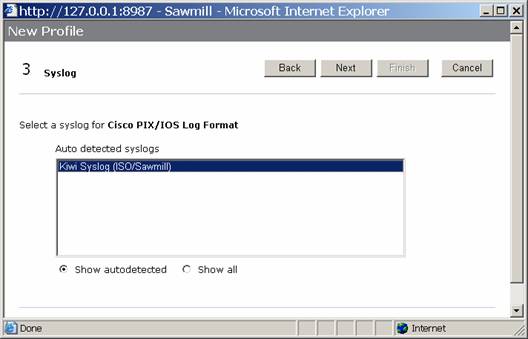
Now, select the Syslog format you probably only have one option and click next:
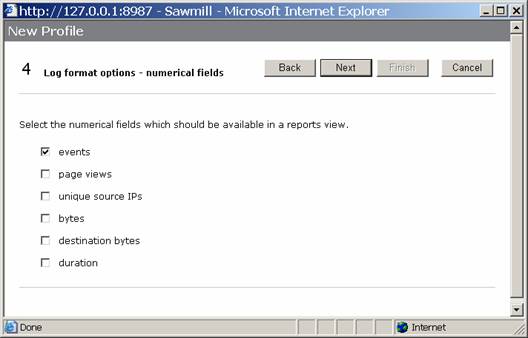
Select the options you want to track. These are indexes and so on that Sawmill will track. Presumably, the more you select, the bigger your database will get and the longer it will take. For our purposes, we will take the default, though you may wish to experiment:
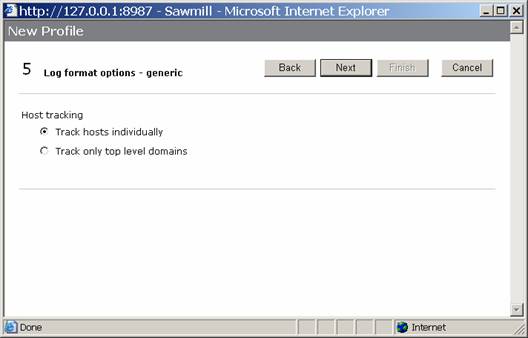
Now, take the next default, to track hosts individually:
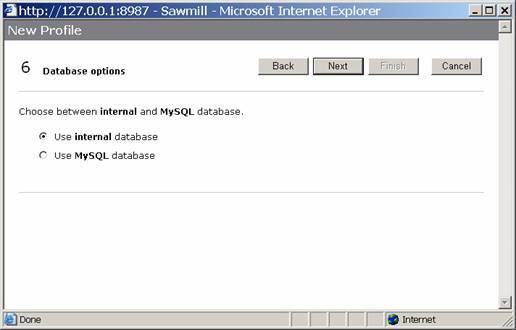
Configure Sawmill to use the internal database. I have not used the MySQL database, but I would imagine that it is faster and scales better:
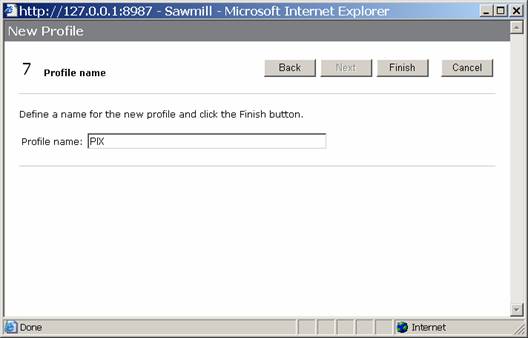
And finally, give your profile a name like PIX and click finish
3.3 View an Example Report
Now that you have a profile, you should be able to generate and view a report. Please note that you dont actually have any data imported into sawmill yet, so the first time you do this might take a little while, depending on how much log data you have. The way this works is that Sawmill reads all the log files, loads the data into its own database, and then generates the reports.
I frequently like to use the one-page summary report, so go ahead and fire up a one-page summary. Click on the show reports link next to your profile, and select Single Page Summary as shown below:
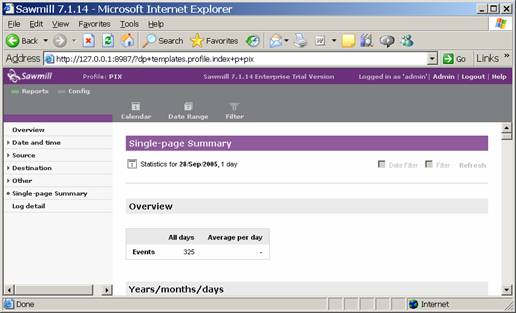
If all went according to plan, you saw the system do some imports, and then ended up with your report. You can page through it and look at what it has to tell you, such as source IP addresses:
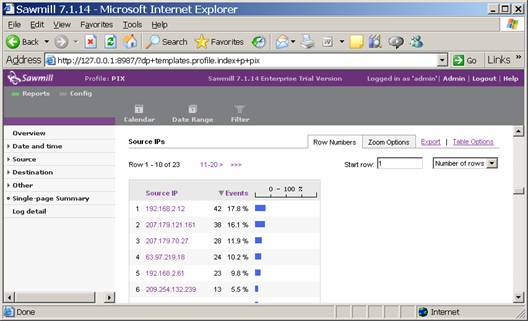
At this point, you are now able to generate firewall reports on-demand. There are a ton of features in Sawmill, and in particular you have an amazing ability to drill down by a single IP address or protocol, but I will leave it to you to RTFM.
3.4 Configure Automatic Update
By default, Sawmill will only update its database with new log data when you tell it to. Hence, we want to create a job to update it every hour. Previously, we told Kiwi to create a log file each hour. Similarly, we now want to tell Sawmill to import a log each hour. Thus, your Sawmill database will only be < 1hr behind your firewall in terms of the data it has. This has the added bonus also of not making for some huge data imports. I have seen imports of large data files take the better part of a day on fast machines, so believe me this can be a hassle. To do this, we are going to create a scheduled event.
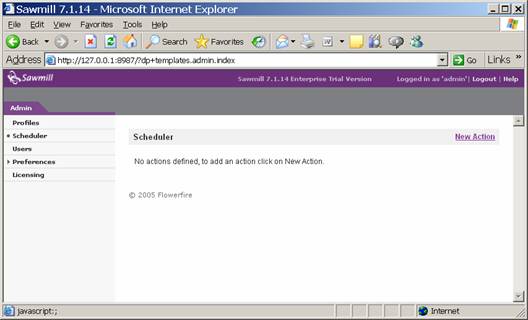
First, click on the Admin link in the top right of your screen, and select scheduler. Click on New Action
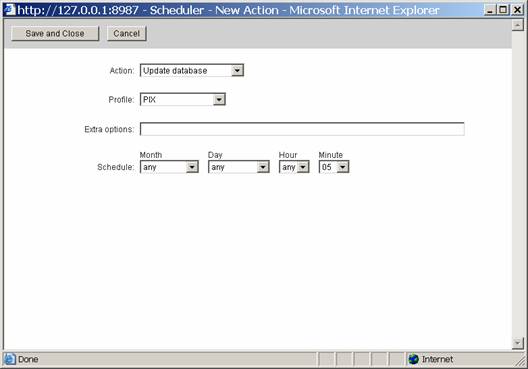
Select Update Database as your Action, and select the PIX as your data source. Next, tell configure the schedule section to be Any, Any, Any, 05. This means that on any month, on any day, on any hour, at 5 minutes past the hour, run this routine. Then do a save and close. Your screen should look like this:
Now, Sawmill should automatically fire off a job to look for new data files and update its database. However, there is one more thing we want to change in terms of how things get updated.
Now click on Profiles, then the Show Config link next to your PIX profile, as seen below:
You should now see the configuration of your PIX profile. Click on Log Data and then Log Processing and you will see a screen such as this:
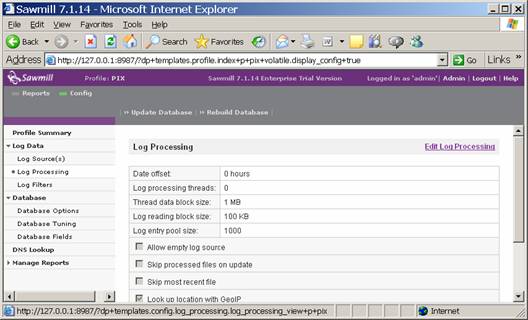
Click on Edit Log Processing and we will change a few default settings. First,
Select Skip Processed Files on Update so that you dont keep re-reading the same files over and over again. Next, select Skip Most Recent File so that it will not read the new file that Kiwi is logging to. Remember, you are running this job at 5 minutes after the hour, so Kiwi has already logged 5 minutes worth of data to a new file.
When complete, you should have options that look like this:
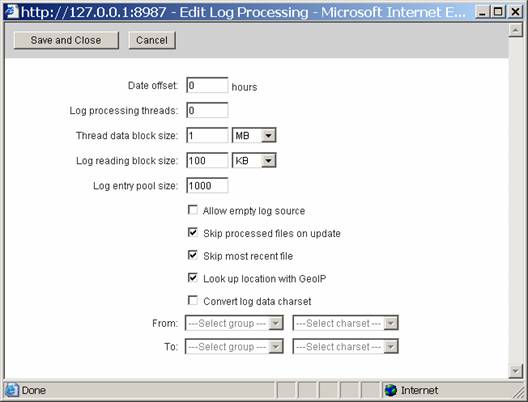
Go ahead and save your changes.
At this point, your Setup should be more or less self-maintaining, and you can go into it at any time and do ad-hoc reports. However, human nature being what it is, this will probably never happen, so we want to create some automated reports that get mailed to us at night.
3.5 Configure Nightly E-Mail Reports
The next useful thing is to get a report mailed to you each night. To do this, we are yet again going to create a scheduled event. Go to Admin, then Scheduler and then click on the New Action link to create another event.
First, select Send Report by Email for the action, then select PIX as your profile. Select the type of report you want, notably the Single Page Summary and tell it to select data for the last 1 days, excluding the current day. Now, select your email settings. Make sure that the machine can actually communicate with your SMTP relay, and that the SMTP relay will accept the email! Configure the job to run on Any, Any, 00, 15. This will tell the job to run every month, on every date, at 12:15am. Hopefully this will give Sawmill enough time to process the last hours worth of logs before it fires up, but if you have a lot of log data, you might want to push this to 30 minutes after the hour or more. Your final screen should look like this:
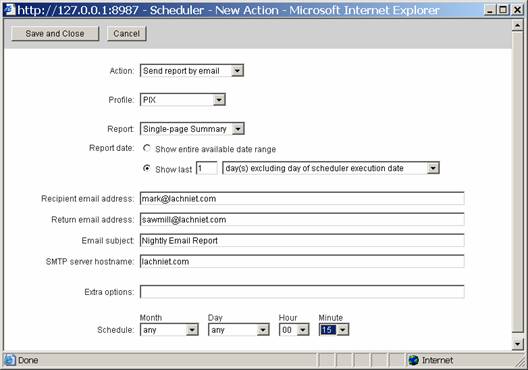
Save your settings, and you should
now start getting nightly HTML emails of your activity! Neat, eh?
3.6 Other Cool Things
There are plenty of other things to do with this software. You really need to stop listening to me and actually read some software documentation for sawmill, but a few things that I like to do are:
Create a scheduled job for daily and monthly reports that are saved to disk. You can just as easily save your reports to disk on the local hard drive (or elsewhere) as you can email them. You might want to create a daily report every day, and a monthly report every month.? You should probably put access control on them via the web server
Modify the amount of detail in the reports. Especially for the one page summary, its nice to have the top 100 IP addresses and ports instead of just the default. To do this, go to Admin, Profiles and Show Config and then select Manage Reports, Reports/Reports Menu and click on the Edit link to the right of the One Page Summary report. Then click on Report Elements, select the criteria you want such as URLs and then click on the Tables link and change the number of rows from 10 to 100 or something similarly. I admit that this option is nested very deeply in the menu structure, but thats why Im writing it down for you! I would do the same thing for all the IP address and host fields as well as the protocols.
Modify the DNS settings. You may want DNS resolution enabled so you dont have to go look them up yourself. To do this, click on DNS Lookup and then Edit DNS Lookup. Click the checkbox to turn it on, type in your DNS servers and the options you want and go nuts.
4.0 Reviewing Logs
Now that you have all of this wonderful log information, you need to have an organized system of reviewing it. Even with all of these pretty charts and graphs, you need some structure to this activity. I suggest you implement the following items:
- Formally task someone with this duty. Put it on their job description. Make sure they have time to do it every morning. If you put them on firefighting duty and break/fix projects theyll never get the job to be proactive.
- Identify a backup. Not only should you have a primary, you should have a secondary so that primary person can take a vacation once in a while.
- Create a duty roster. You should have a checklist or some way of tracking that log review activities were performed each day, and any anomalies. This is a good way to make sure that it actually gets done, and it gets the auditors all excited when you can show it to them
- Create guidelines for interpreting the logs. This is probably the hardest part. If you dont know diddly about firewalls and TCP/IP, youre going to have a hard time identifying what is appropriate and inappropriate behavior. In part, you will simply start learning what is normal for your network, and over time it will be obvious what is out of place. However, here are a few guidelines to get you thinking:?????
Host and IP Addresses. You should normally see the same hosts getting large amounts of traffic on a regular basis. Web servers, Citrix servers, mail servers and the like will usually be busy servers. If, all of the sudden, a mysterious internal or DMZ server makes it to the top-5 list of traffic users, you probably have some new and unexplained behavior on that server to look up. Also be concerned if you see a large amount of traffic from a specific external server they might be probing your network, or otherwise abusing you. In these cases, youll want to log into Sawmill and run an ad-hoc report based on just that IP address so you can nail down exactly what is going on.
Protocol Usage. Normally, you will see a lot of traffic on ports 80, 443, 25, 110 and similar normal ports. If, all of the sudden, you see a spike in traffic on an unusual port, it should be investigated. Really bad ports to see in your top 5 include SQL (1433) and NetBIOS, though this may be normal for your network.
Time of Day. A lot of times, hackers work in different timezones, in large part because they are in Europe, China, or South America. Depending on your network, you
Control. Look in the section of the report dealing with control and you will see the commands that were entered into the CLI of the PIX. This is a really inefficient way to do change control. If you see a bunch of stuff in there you definitely didnt do, I would be concerned.
- Back Up Your Logs. You should make sure that your Sawmill server is backed up. Its a pain to lose those logs, so put it on your SAN, back it up to tape, and do whatever else you would normally do with important data.
5.0 Final Comments
Although this document is far from comprehensive, it should give you a good start. Once you get this baseline of security established, you should move on to other neat projects. Among the things I would suggest you look into (and that I would consider writing a whitepaper for) are the following:
Logging Windows event logs to syslog. Yes, you can do this! Not only can you do this, but you should do it. Get a program to forward every event that occurs on your Windows boxes to Kiwi. Then create a Kiwi filter to split out the logs to different files. You then have forensic data in case the lose hackers wipe out your event logs. You can also configure Kiwi to page you when certain events occur (like failed admin logins) which is really handy
Cryptographically sign your logs. If forensic validity is important to you for example if you have a lot of money riding on the security of your systems you should create a batch file to create a one-way hash of your log files when they are created. Using a program like MD5SUM will help here, or a similar program. This will help your case in court, and help you to prove that nobody tampered with the logs.
Use Kiwi to Alert you automagically. If you get the registered version of Kiwi, you can get pages and e-mails when certain things happen. For example, when your ISP serial circuit flops up and down, or when someone does a configure term on your firewalls and routers. Its nice to have that information. You can even have it play a little WAV file for you.
Use CatTools to backup your configs. Check out the tool at http://www.kiwisyslog.com/cattools2.htm. You can use this to manage your device configs, which saves you a lot of cut and pasting.